
One Marsh, Many Windows: A Year of Birds Across Rumney Marsh and the Saugus River Estuary
What 143 species, 250 outings and uneven access reveal about a complex coastal landscape
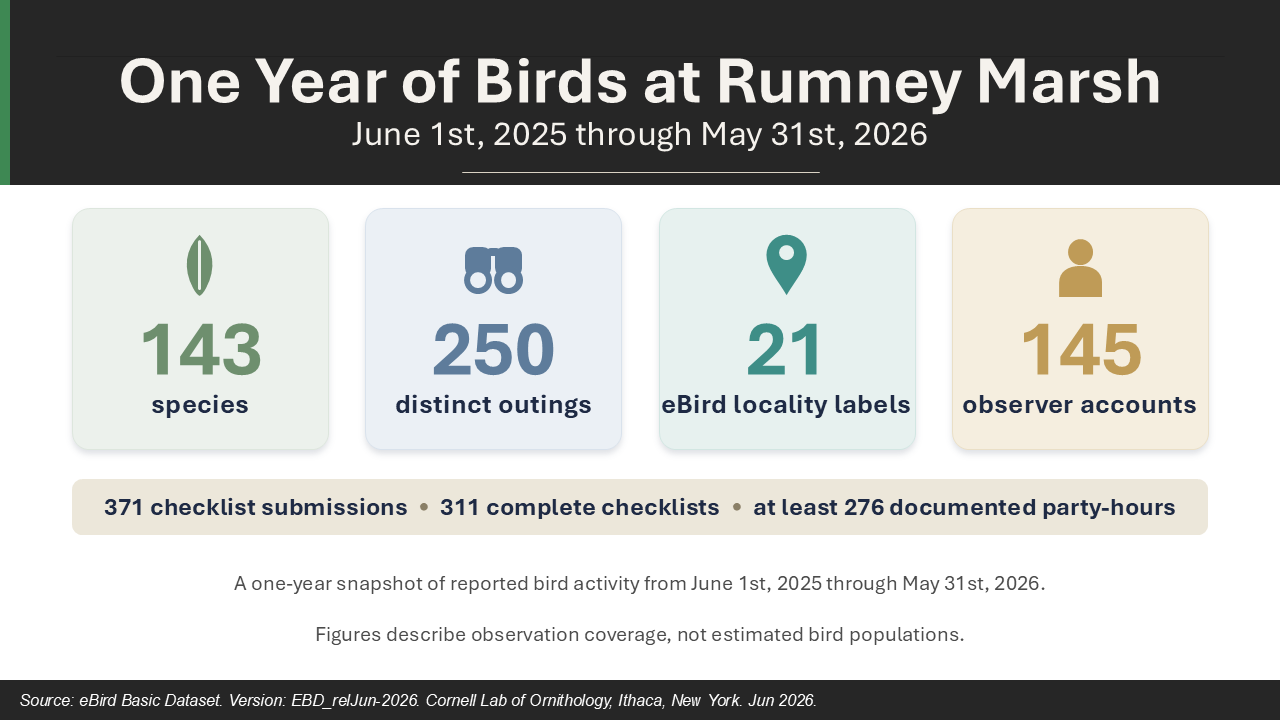
Rumney Marsh isn’t a single birding site, it’s a broad estuarine landscape of salt marsh, tidal river, mudflat, panne, open water, grassland, filled upland, brushy edge and heavily altered earth. The eBird records submitted between June 1st, 2025 and May 31st, 2026 reflect that complexity, but they also reflect something else: where people have access, when they choose to visit, how long they stay and what kind of birding effort a site attracts.
During the sample period, the workbook contained 371 checklist submissions from 145 observer accounts. After checklists linked through eBird’s shared group identifier were consolidated, those submissions represented 250 distinct outings across 21 locality labels. Observers documented 143 species and at least 276 hours of group-collapsed field effort.
Those numbers make a strong case for the ecological variety of the Rumney Marsh and Saugus River estuary, but they shouldn’t be treated as a census. They are many windows into the marsh, each with a different view.
What this report measures
The analysis counts only records categorized by eBird at the species level. Domestic forms, broader species groups, slash records and identifiable subspecies groups were excluded from the 143-species total so they wouldn’t be counted as separate species.
Shared group checklists were consolidated when calculating outings because a single birding party can generate several nearly identical submissions. For consistency percentages, however, the report uses the 311 checklist submissions marked as complete, meaning the observer indicated that all species detected and identified were reported. This is an important distinction. A species listed on 70 percent of complete checklists was consistently encountered across submitted surveys. It doesn’t mean that species made up 70 percent of the birds present.
The report also avoids summing every individual count into a grand abundance figure. Repeat visits, shared checklists, moving birds and different counting methods would make that number sound more precise than it really is.
The year was observed unevenly
Bird activity changes through the seasons, but observation effort changed just as much. April produced 34 outings and 75 species, while May produced 30 outings and the year’s highest monthly total, 82 species. June had the most outings at 41, with 66 species documented during the early breeding season. October stood out as a productive migration month, with 63 species from 16 outings.
At the other end of the spectrum, August had 8 outings, September had 9 and February had 9. September’s records represented less than three documented hours of group-collapsed effort and produced only 28 species. This should be interpreted as an obvious coverage gap, not evidence that the marsh suddenly became quiet. August still produced 46 species from limited coverage, and February produced 41.
The monthly curve is therefore a combination of migration, breeding, winter residency and observer behavior. Months with more visits, longer outings and broader site coverage will generally produce longer species lists.
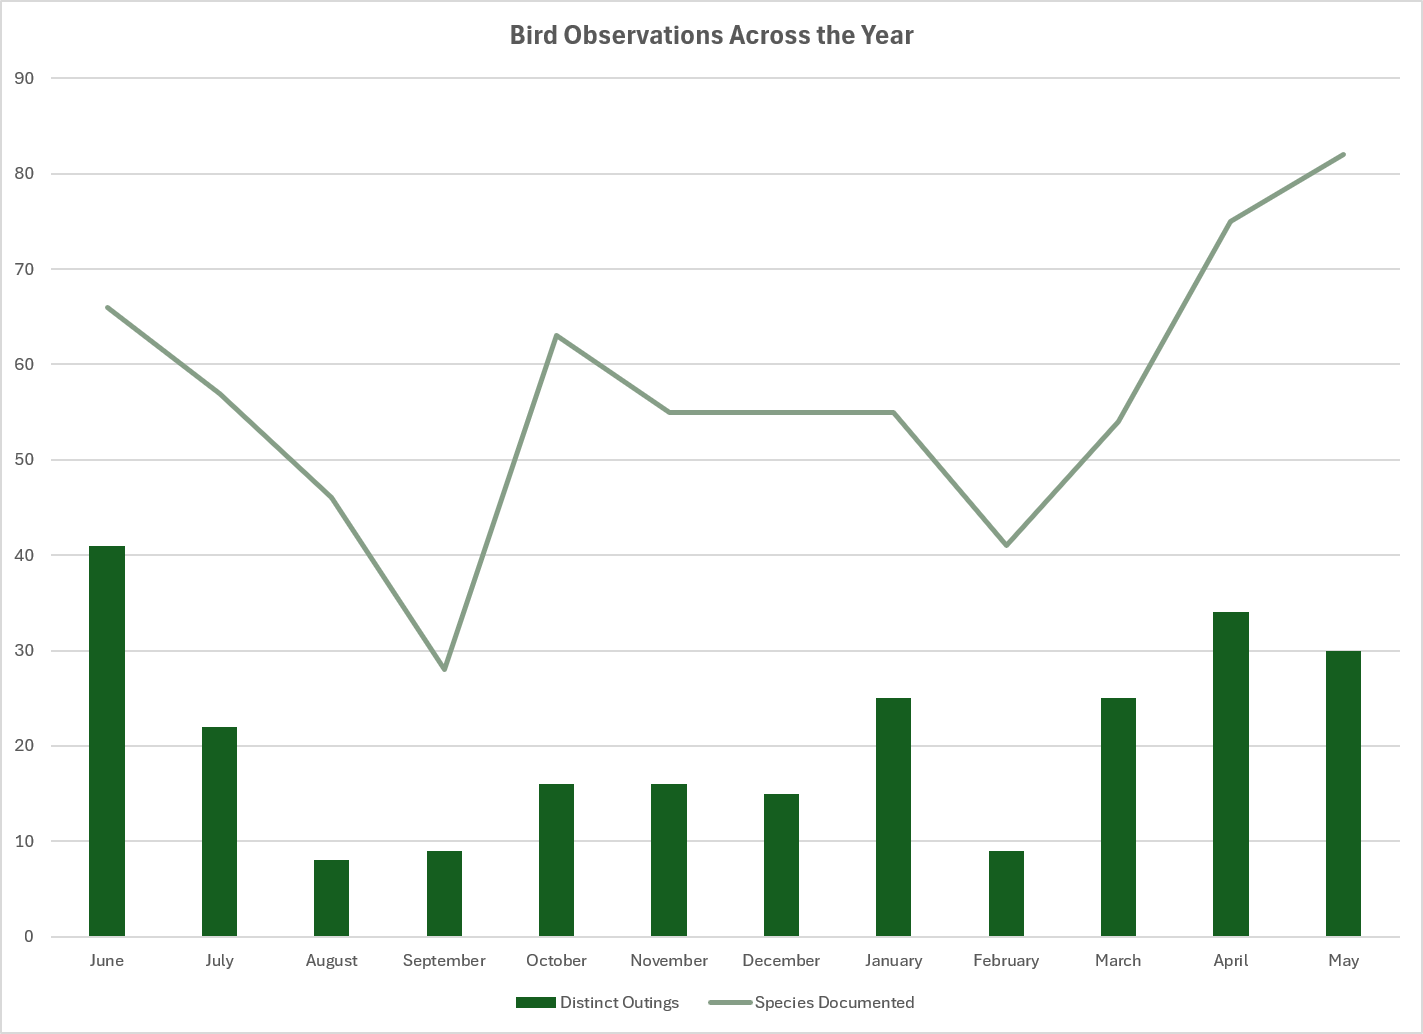
Monthly species totals rise and fall with both the birds and the amount of observation effort. Sparse months should be interpreted as opportunities for additional coverage.
Many windows into one marsh
The 21 locality labels in the file don’t represent 21 neatly separated habitats. Some are established eBird hotspots, some are personal locations, some cover broad areas and several are alternate names for nearly the same access point. Still, the pattern shows where the public and organized birders are actually seeing the marsh.
Hastings Street accounted for 62 distinct outings, Bear Creek for 61, Bristow Street for 36, Saugus River Marshes for 23, Mills Avenue for 16, the Model Airplane Field for 11 and Vitale Park for nine. Together, those seven labels accounted for 218 of the 250 outings, or 87 percent. The remaining 32 outings were spread among broader Rumney Marsh locality labels, Ballard Street, Oak Island Pannes, Route 107 and eastern-edge points, Pines River monitoring locations, Northern Strand viewpoints and Rumney Marsh Terrace.
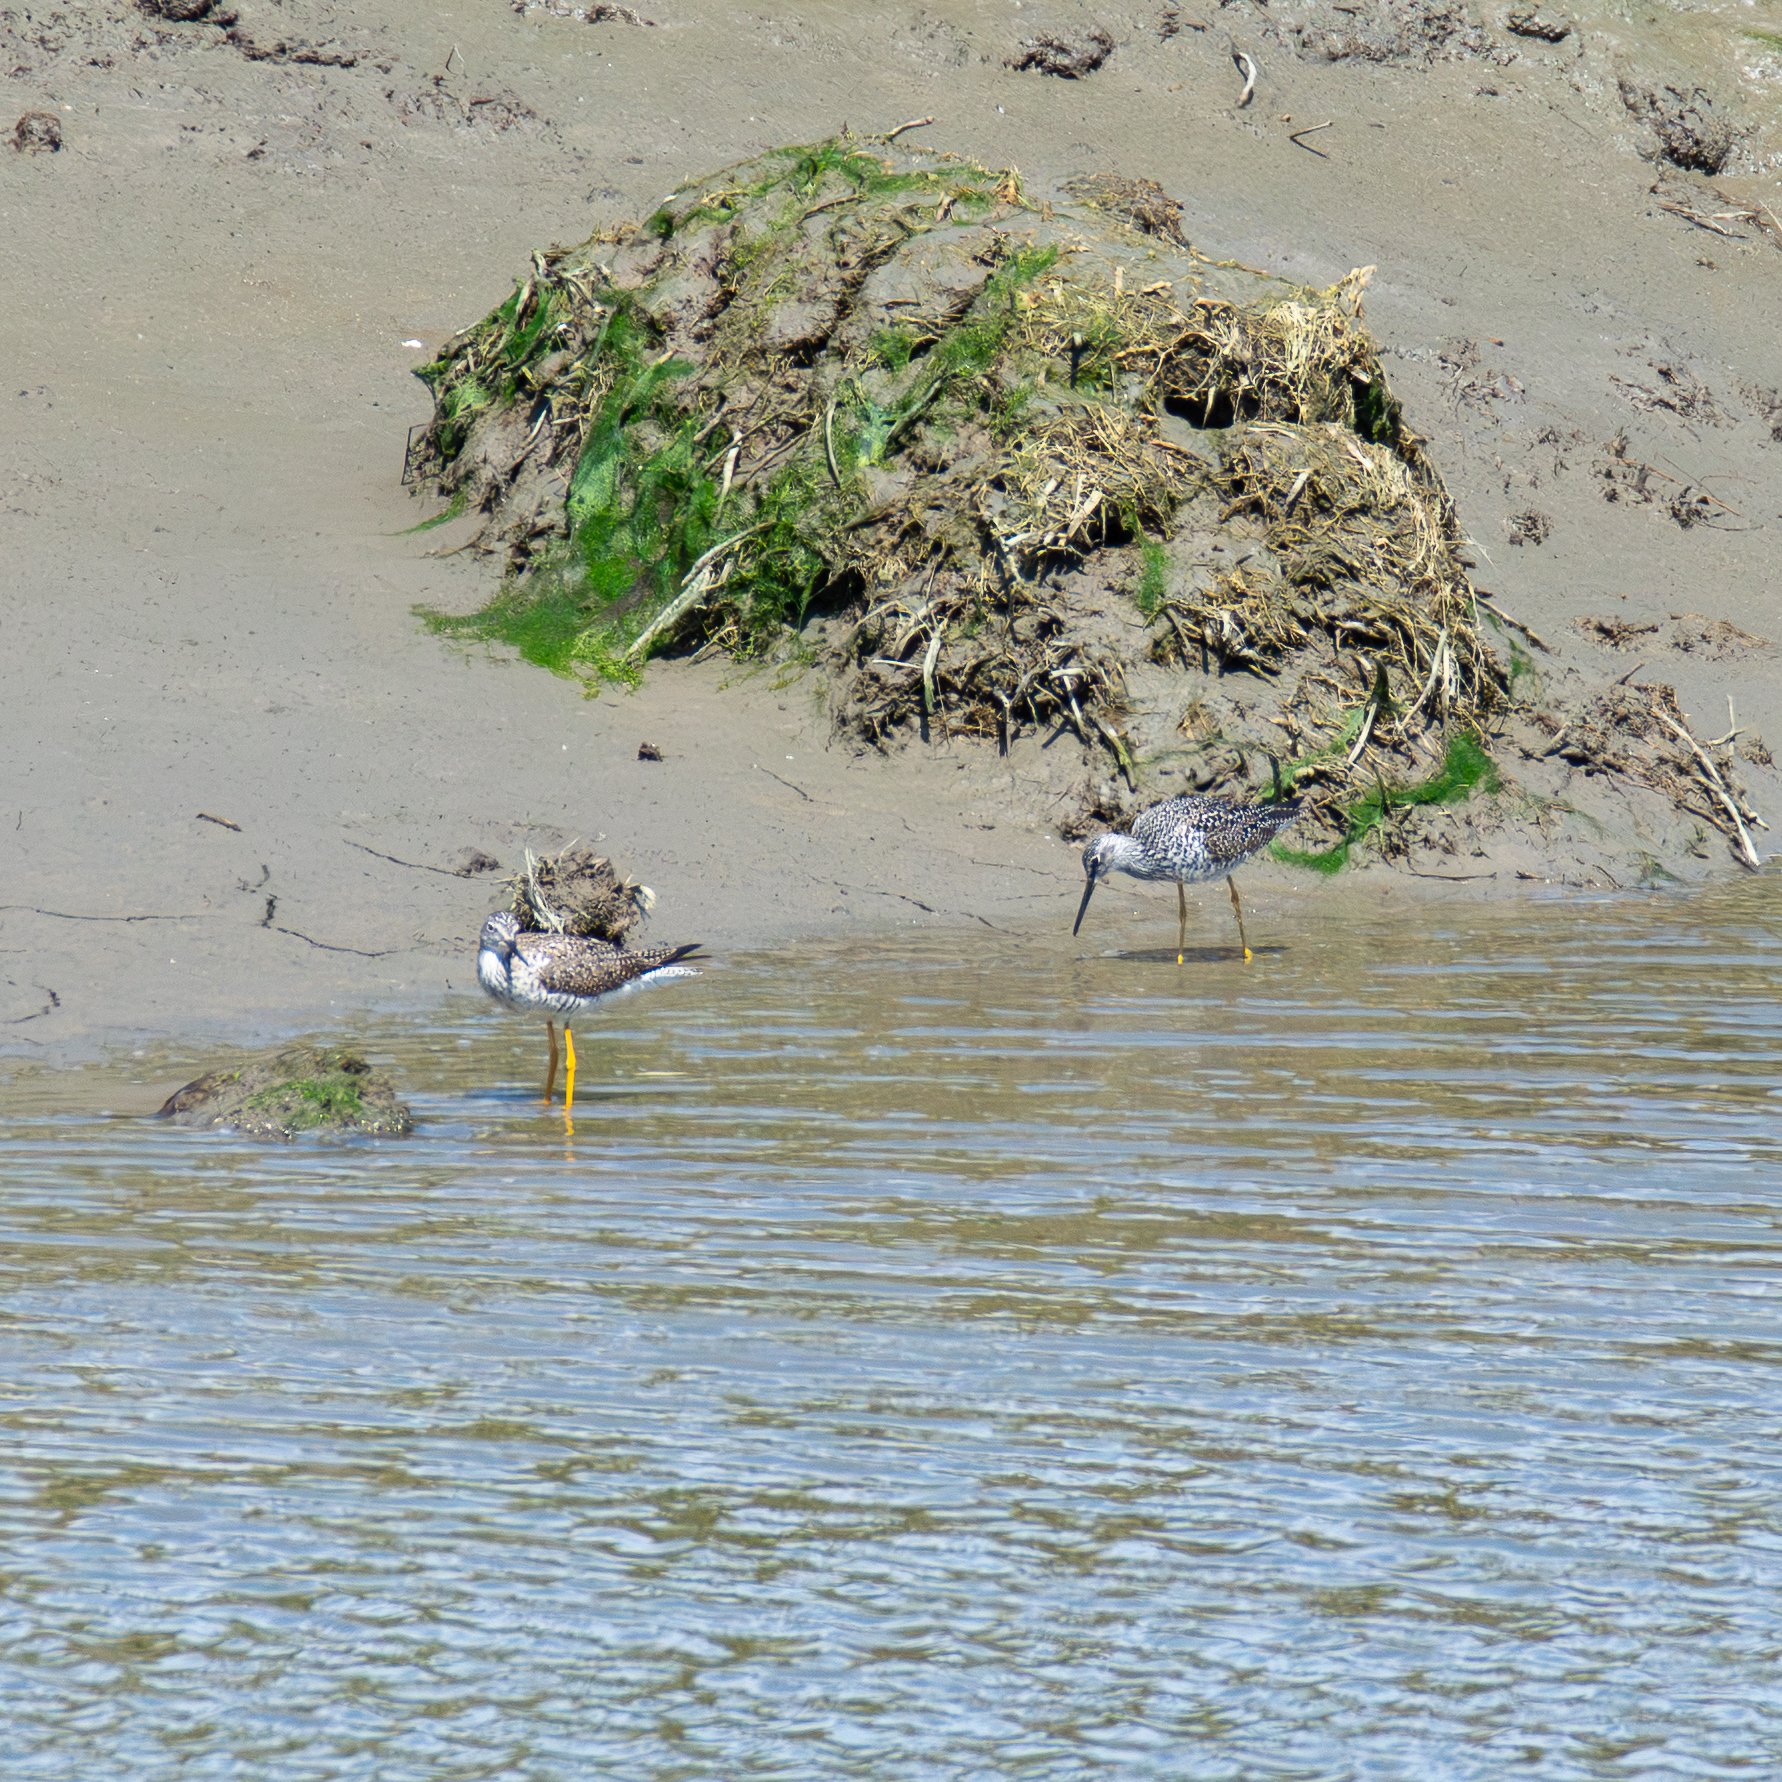
Each of these locations is a window, not a boundary. Hastings Street looks directly into extensive salt marsh and high-marsh habitat. Bristow Street combines marsh edge, open water, disturbed upland and a long walking route.
The Saugus River Marshes hotspot captures a riverine and estuarine perspective.
Mills Avenue and Vitale Park offer smaller, public-facing riverside views.
Ballard Street had only six outings but produced 31 species, including Yellow-crowned Night Heron on four group-collapsed outings. A lightly visited site can still contribute records that barely appear elsewhere. Conversely, a long list from a heavily visited site doesn’t automatically mean it has better habitat. It may simply have better access, more experienced observers, longer surveys or more complete seasonal coverage.
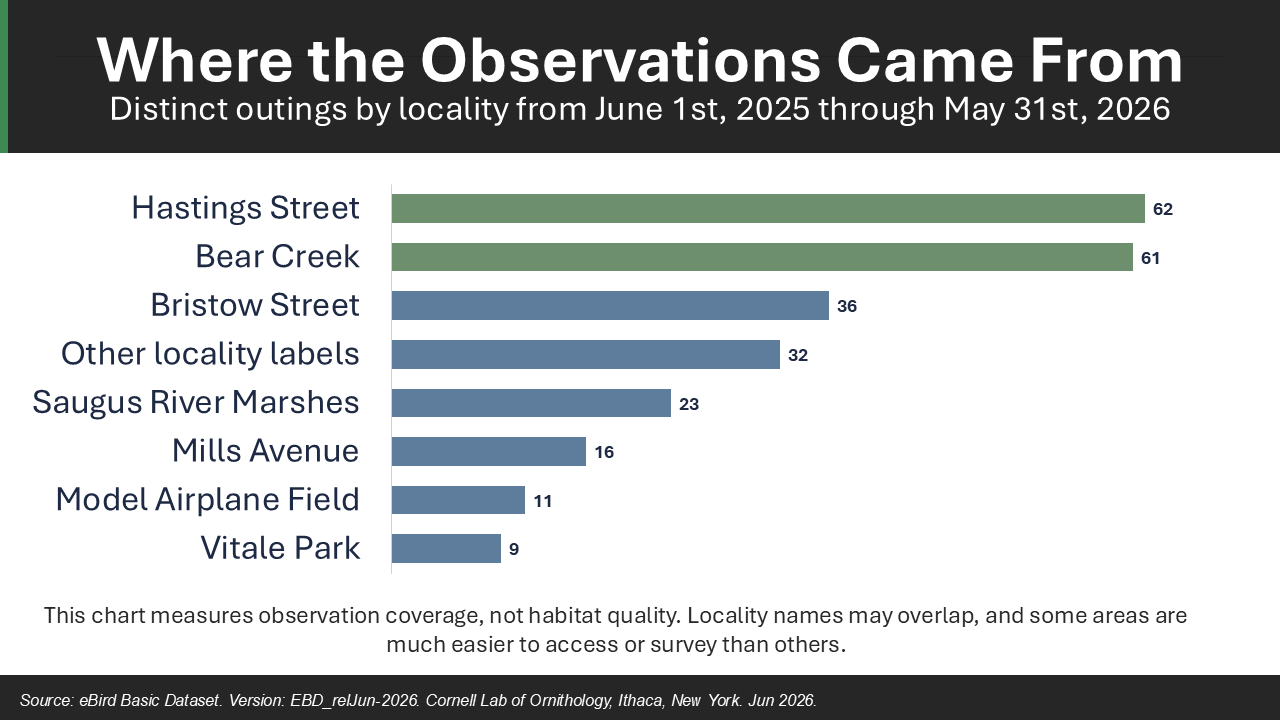
Bear Creek and the effect of restricted, but sustained access
The Bear Creek (restricted) eBird locality accounted for 61 group-collapsed outings and 107 species, the largest species list associated with any single locality label in the dataset. That number needs context. Bear Creek also generated 165 individual checklist submissions because an organized visit can produce separate lists from multiple participants.
By comparison, Hastings Street produced 88 species from 62 outings, and Bristow Street produced 89 species from 36 outings. These figures are not a ranking of which site is most valuable. They show how strongly access and survey design shape the record.
Public birding at Bear Creek generally takes place through organized landfill tours. Participants need to know the program exists, commit roughly four hours and remain with an escorted group. Because visitors must be accompanied, leaving early is discouraged. That arrangement tends to attract experienced and highly committed birders. They spend several hours surveying an area that isn’t normally accessible to the public, often with multiple observers working together. That sustained effort helps explain the length and detail of the species list.
The site has also historically been associated with a commitment to rotational grassland mowing. Grasslands are an increasingly scarce habitat type in Massachusetts and can provide important nesting, feeding and migration habitat for birds. It’s not known whether the operator still follows that management practice, but thoughtful mowing schedules could help maintain some of the open habitat reflected in these observations. The records include Bobolink, Eastern Meadowlark, Upland Sandpiper, Savannah Sparrow, American Kestrel and Short-eared Owl, species that help distinguish Bear Creek’s open-ground contribution from the more traditional salt-marsh view.
Bear Creek is also part of the larger Rumney Marsh landscape. Many birds recorded there are using the marsh, river, grassland and coastal habitats that surround it. The records mainly show what can be documented when serious birders receive sustained access to an otherwise difficult-to-observe portion of the marsh.
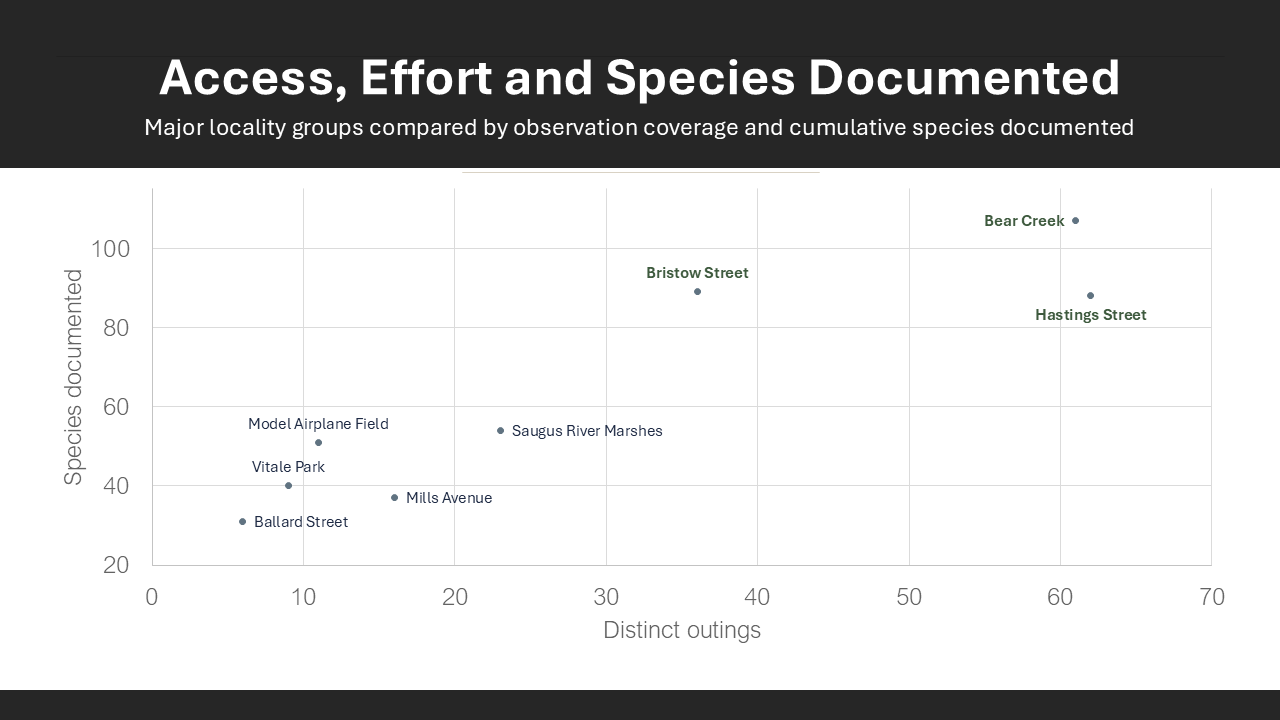
Species totals reflect habitat, access, timing and observer effort together. They shouldn’t be read as a simple scorecard of ecological quality.
The birds reported most consistently
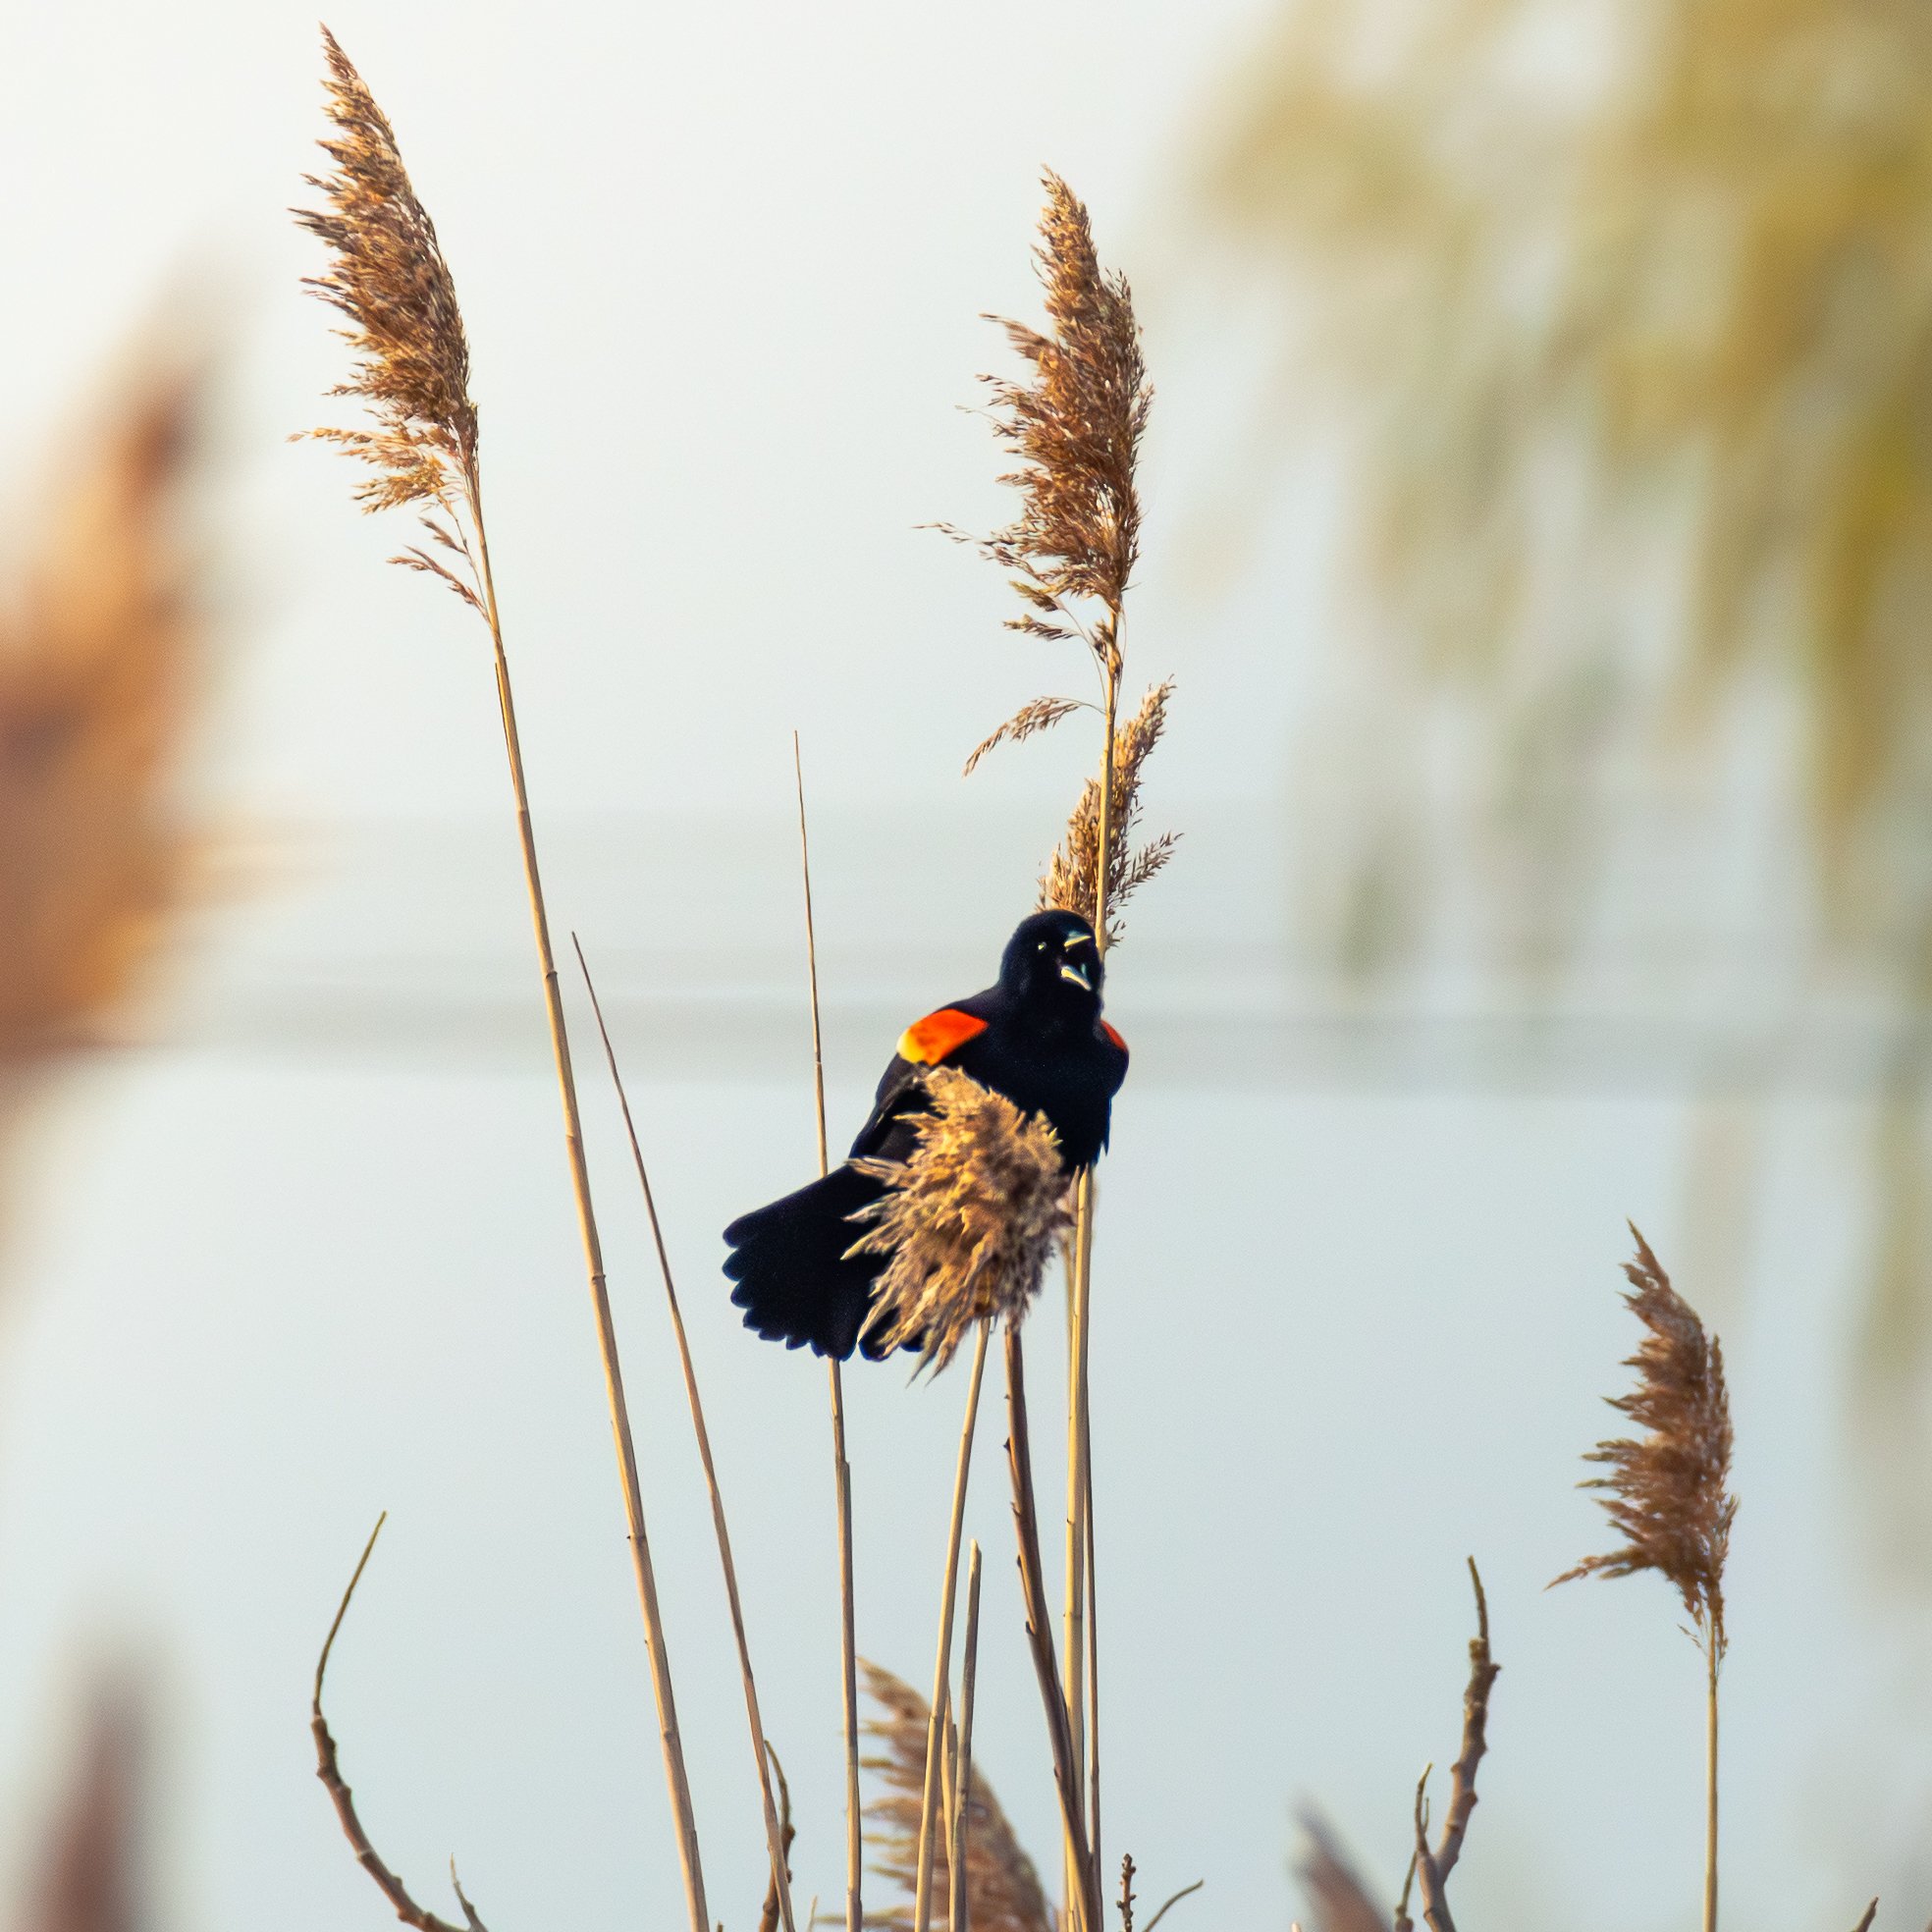
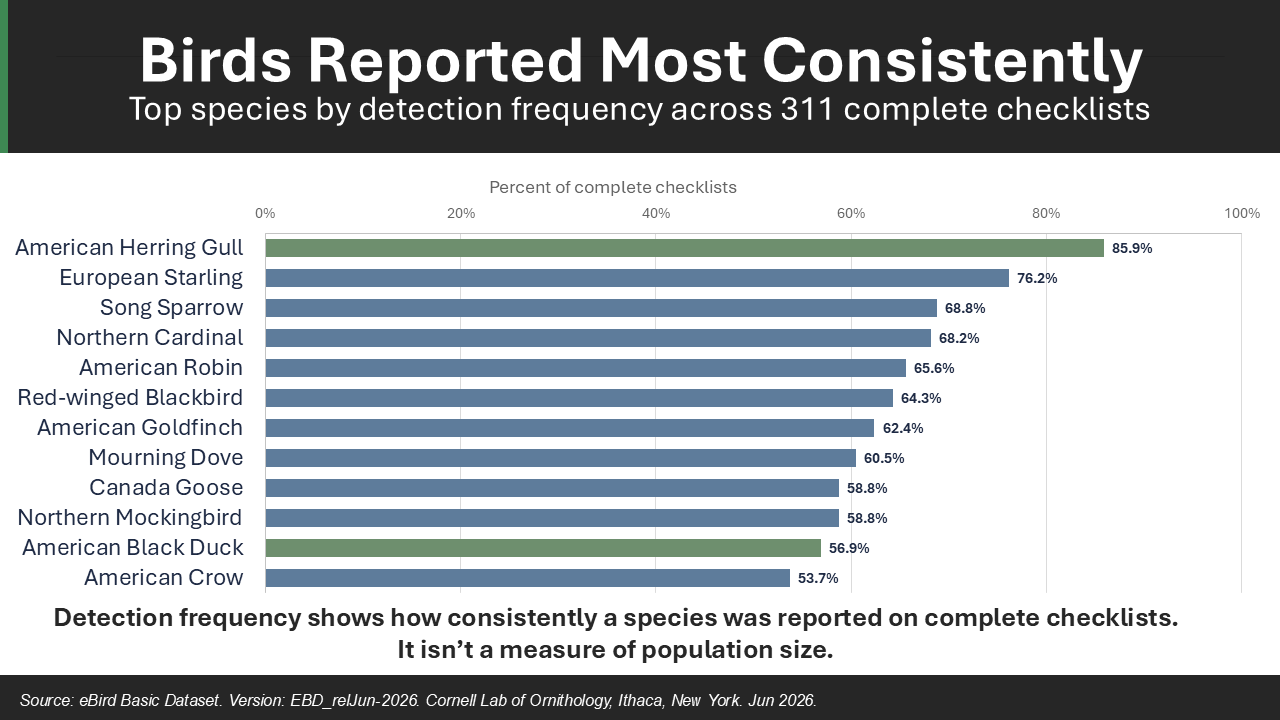
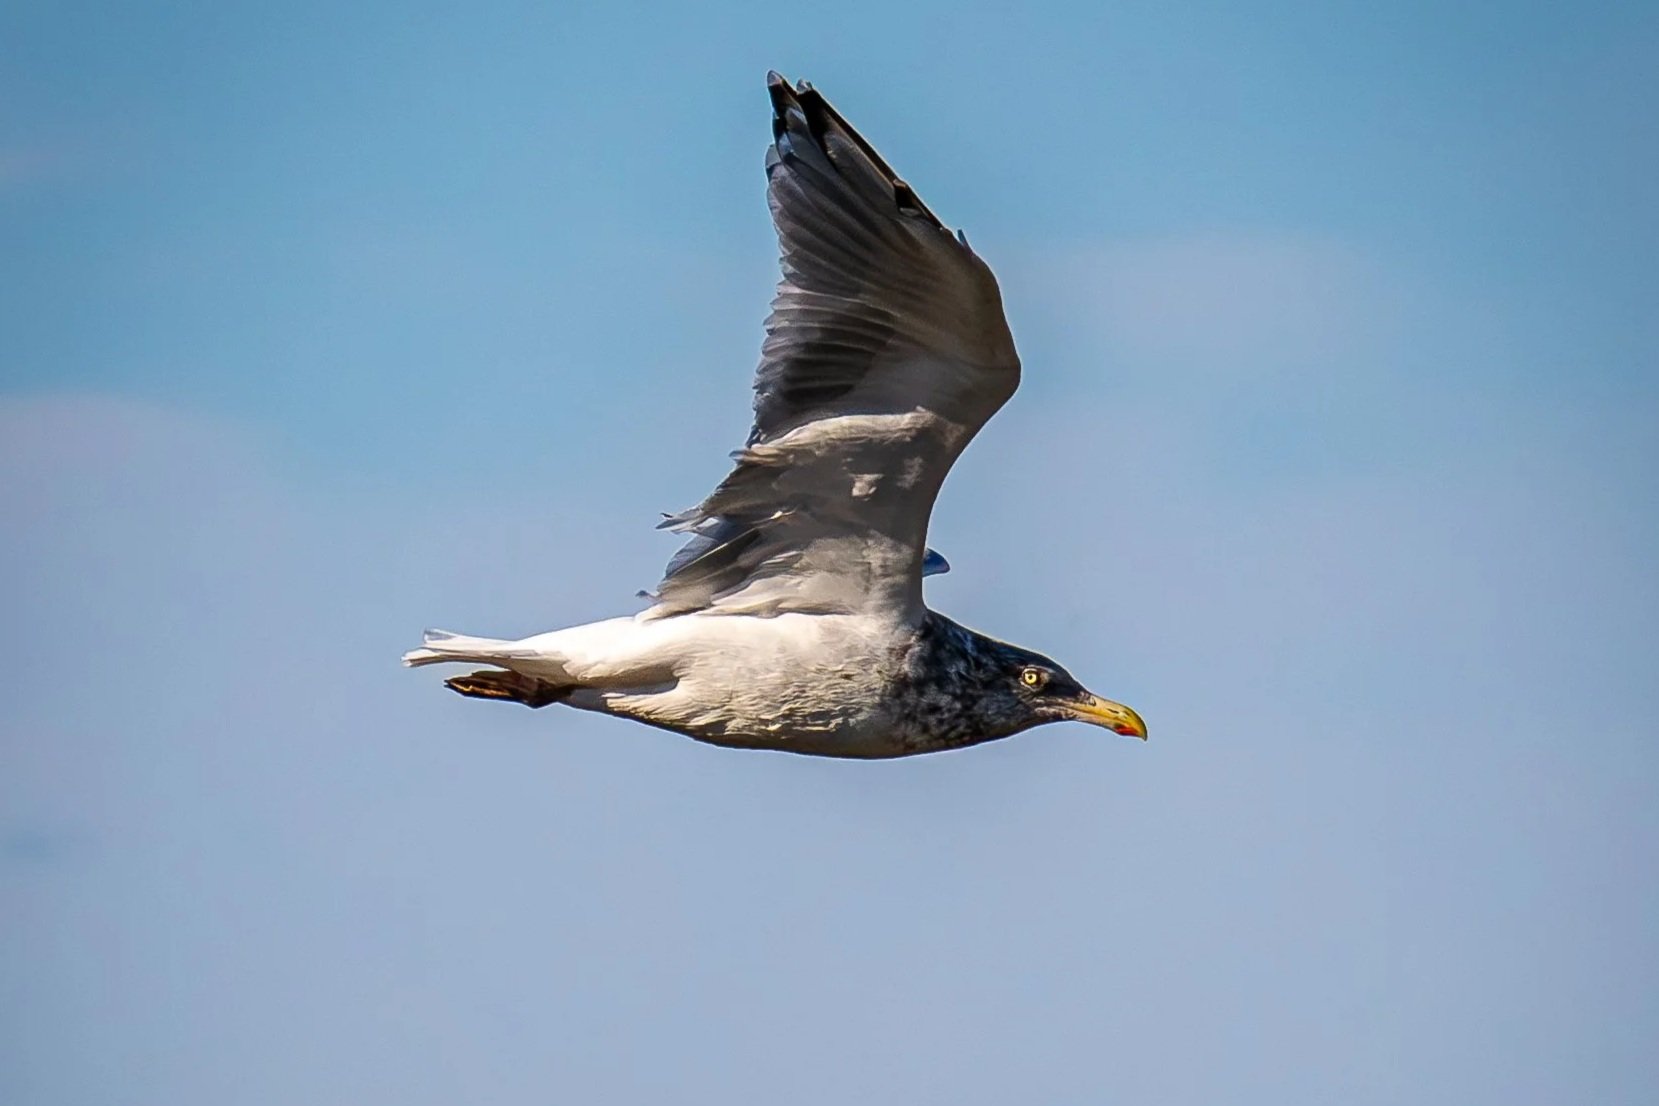
The most consistently reported species tell a useful story about the landscape. American Herring Gull appeared on 86 percent of complete checklists, followed by European Starling at 76 percent. Song Sparrow appeared on 69 percent, Northern Cardinal on 68.2 percent, American Robin on 65.6 percent, Red-winged Blackbird on 64 percent, American Goldfinch on 62.4 percent and Mourning Dove on 60.5 percent. Canada Goose and Northern Mockingbird each appeared on 58.8 percent, American Black Duck on 56.9 percent and American Crow on 54 percent. This isn’t a list made up only of iconic salt-marsh birds. It mixes gulls, waterfowl, marsh-edge birds, suburban generalists and upland songbirds. That blend is exactly what should be expected from a large coastal wetland embedded within an urban landscape and crossed by filled ground, roads, trails, industrial land and residential edges.
American Black Duck is particularly useful in that list because it links the year-round checklist pattern back to the estuary. Great Egret, Snowy Egret, Osprey, Double-crested Cormorant and Willet were also recurring parts of the record, even when they didn’t make the top 12.
Traditional marsh birds and upland birds overlap here
“Traditional marsh species” is an informal phrase, not a scientific category, but it helps describe the birds people expect to see in a tidal estuary. The year’s records included Saltmarsh Sparrow, Clapper Rail, Willet, American Black Duck, Great Egret, Snowy Egret, night herons, shorebirds, gulls, terns and waterfowl. Some were strongly associated with a particular window. All 18 Saltmarsh Sparrow outings came from Hastings Street. All nine Clapper Rail outings came from Hastings Street. Fifteen of the 20 Willet outings also came from Hastings Street. Other species, including Great Egret, Snowy Egret, Osprey and American Black Duck, appeared across multiple public and restricted localities.
The upland pattern was just as real. Bobolink appeared on six outings, all at Bear Creek. Eastern Meadowlark appeared on 15 outings, 14 of them at Bear Creek. The single Upland Sandpiper record came from Bear Creek. American Kestrel appeared on 22 outings, 18 at Bear Creek, while Savannah Sparrow appeared on 32 outings, 23 at Bear Creek. Short-eared Owl appeared on 10 outings across seven dates, with seven of those outings at Bear Creek and the others at Bristow Street and eastern-edge or Route 107 locations. These are detection counts, not estimates of how many birds used the area, but the concentration is notable.
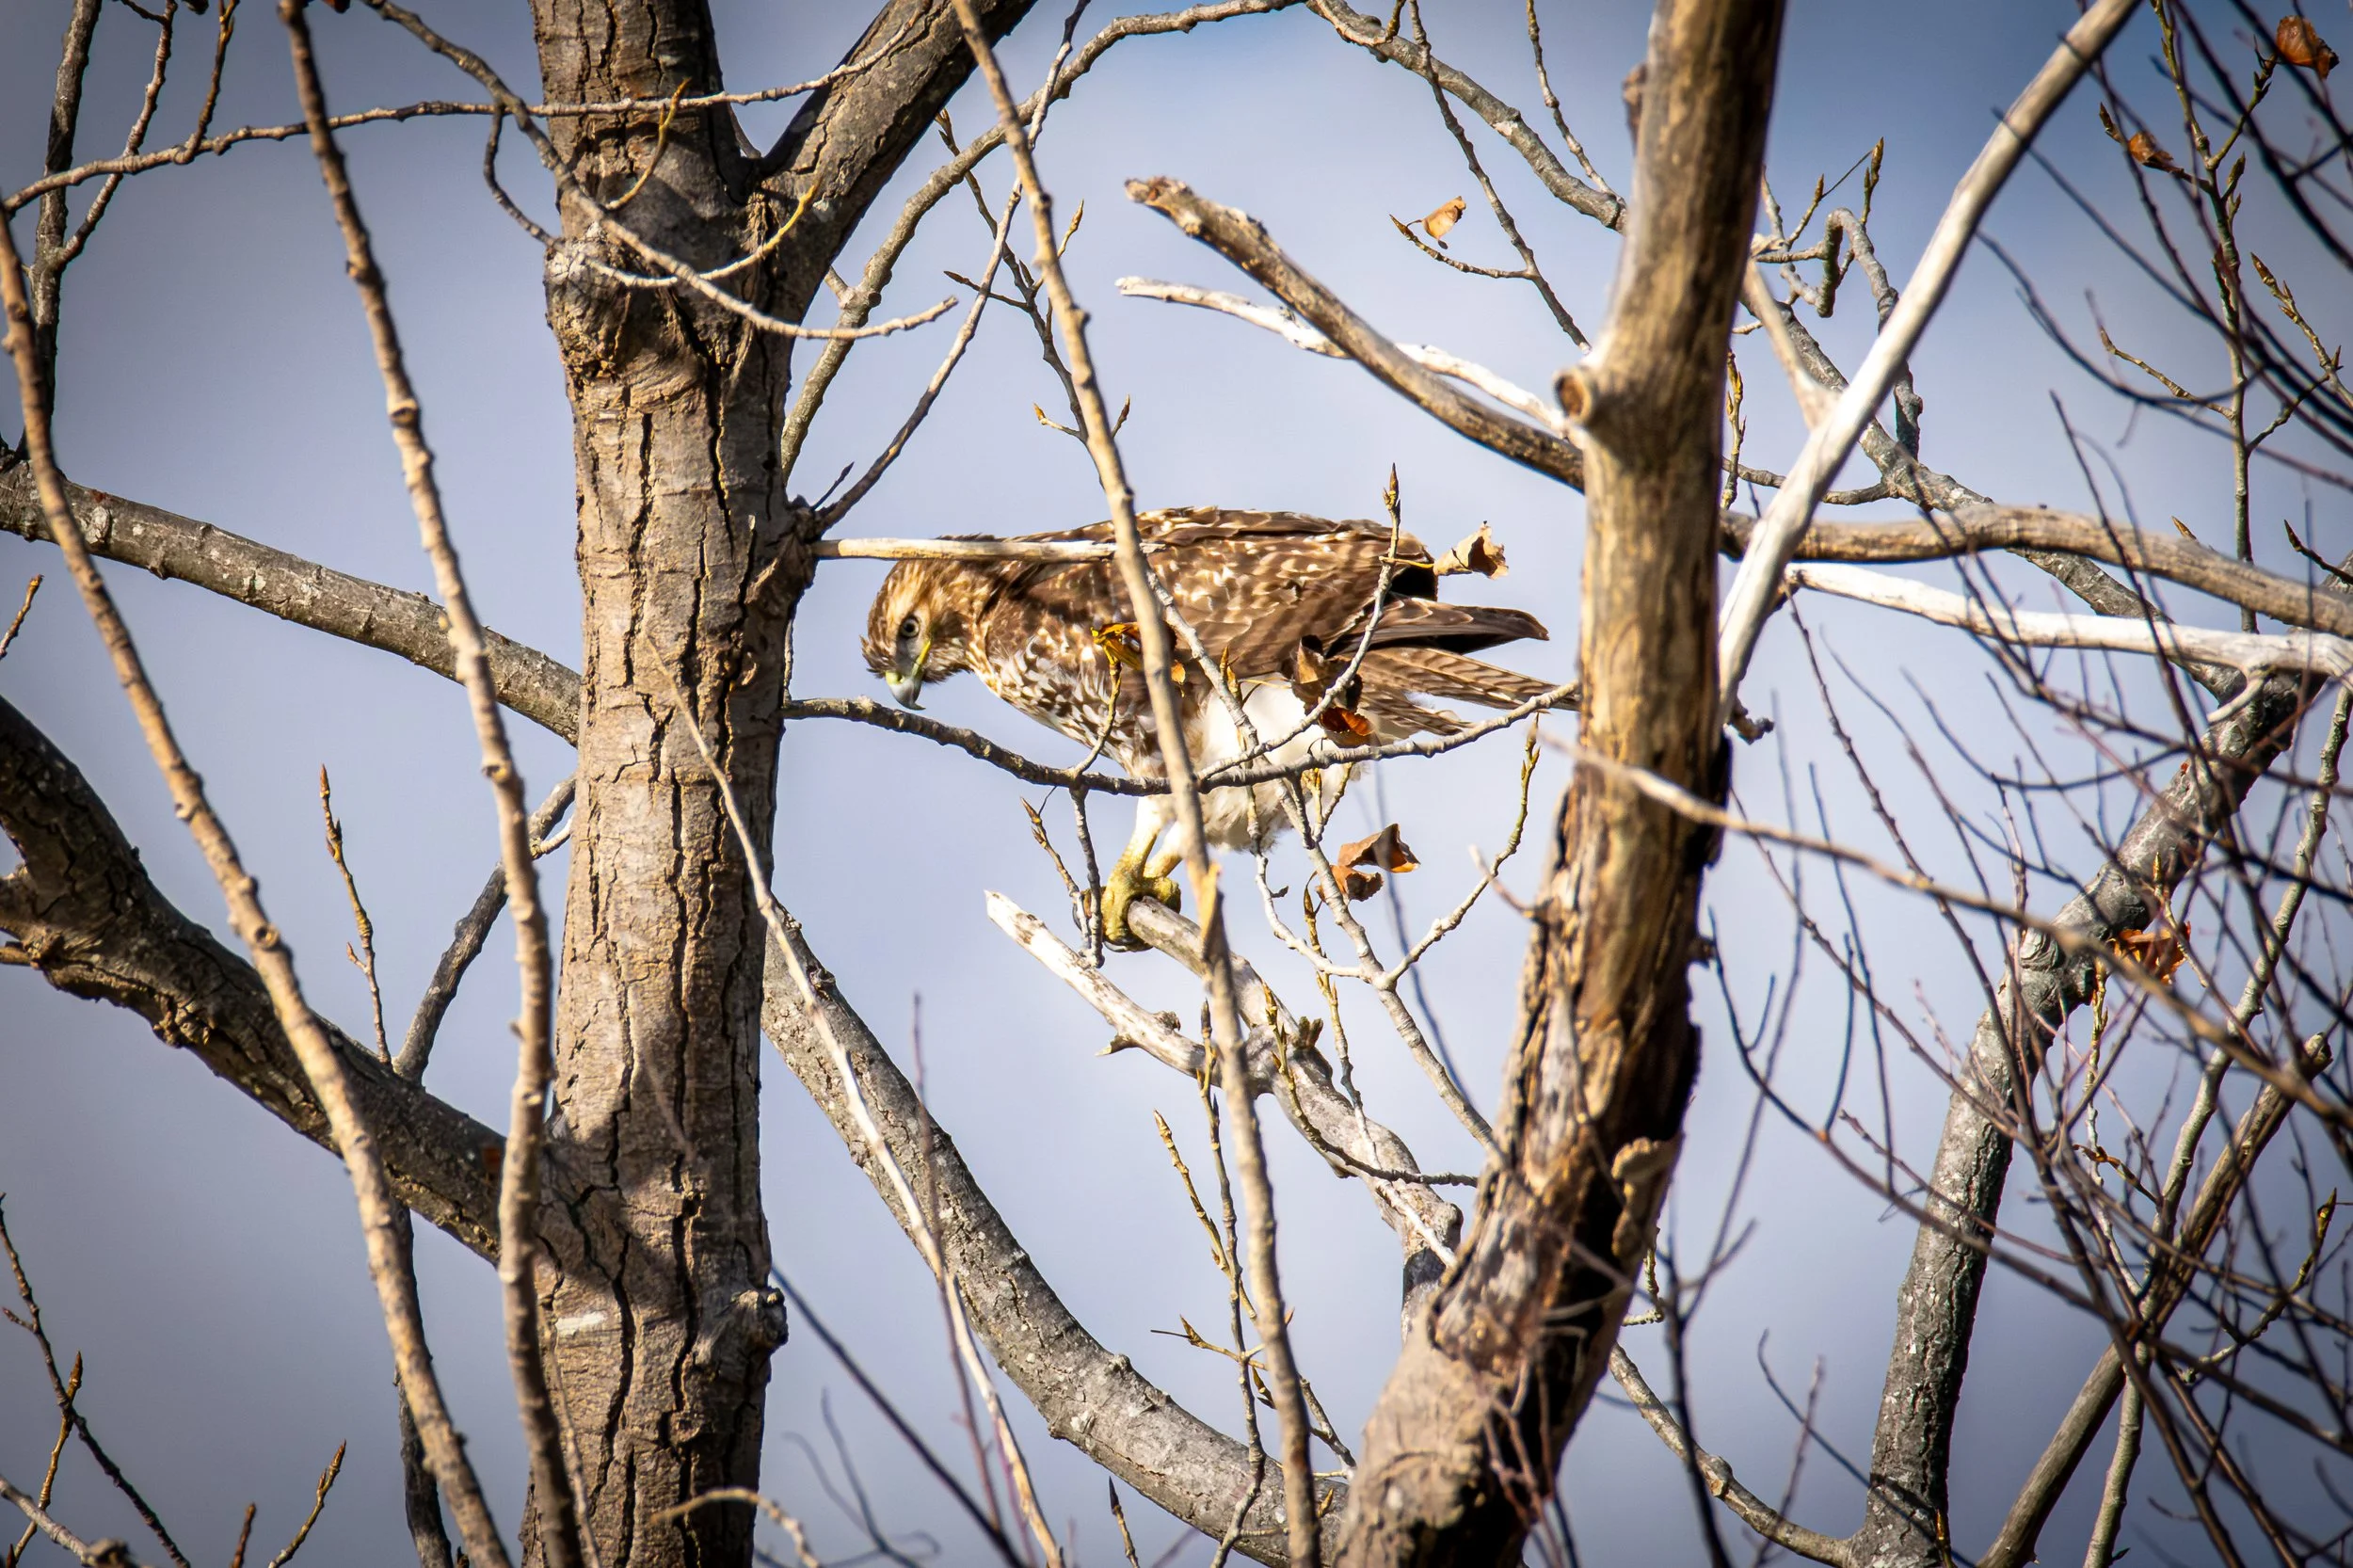
That overlap is normal in Rumney Marsh. The estuary is not an uninterrupted field of cordgrass. It includes filled uplands, landfill cover, brush, road edges and disturbed grassland. Some upland concentrations may also relate to the 2.4-mile abandoned I-95 embankment, a long strip of artificial fill running through the marsh. The data can’t assign a cause to any individual sighting, and it shouldn’t be used to romanticize fill that replaced or altered wetland habitat. It does show that today’s bird community responds to the full, complicated landscape that exists now. Protecting the marsh means understanding both the tidal habitat that defines it and the upland and edge habitats that birds are also using.
Saltmarsh Sparrow: a protected species tied to the high marsh
Saltmarsh Sparrow deserves special attention because it is not simply another sparrow passing through. It is a tidal-marsh specialist whose breeding life is tied to high salt marsh. Massachusetts lists the species as Special Concern under the Massachusetts Endangered Species Act. At the federal level, it wasn’t listed under the Endangered Species Act during the report period, and federal action on a possible listing remained pending. The U.S. Fish and Wildlife Service describes it as the only bird species that breeds solely in the salt marshes of the northeastern United States and estimates that the population has declined by 87 percent since 1998. Its nests are vulnerable to increasingly frequent high-tide flooding, storm surge and the loss or degradation of high-marsh habitat.
Within this dataset, Saltmarsh Sparrow was recorded on 18 group-collapsed outings across 17 dates, every one of them at Hastings Street. There were seven outings in June 2025, six in July, two in August, two in September and one on May 20th, 2026. The highest single reported count was 20 birds on July 13th, 2025. Those repeated summer detections are significant evidence that the Hastings Street window reaches habitat used by the species. They are not a population estimate, and they don’t prove that Saltmarsh Sparrows were absent from every other portion of Rumney Marsh. Much of the marsh interior is difficult to reach and was not surveyed with equal intensity.
For management and conservation, the important question is not only whether a Saltmarsh Sparrow appears on a checklist. It’s whether the marsh retains enough high-elevation nesting habitat, whether tidal flooding allows successful nesting cycles, whether the marsh can migrate or build elevation over time and whether restoration decisions protect the hydrology and vegetation the species depends on.
The long tail of the species list
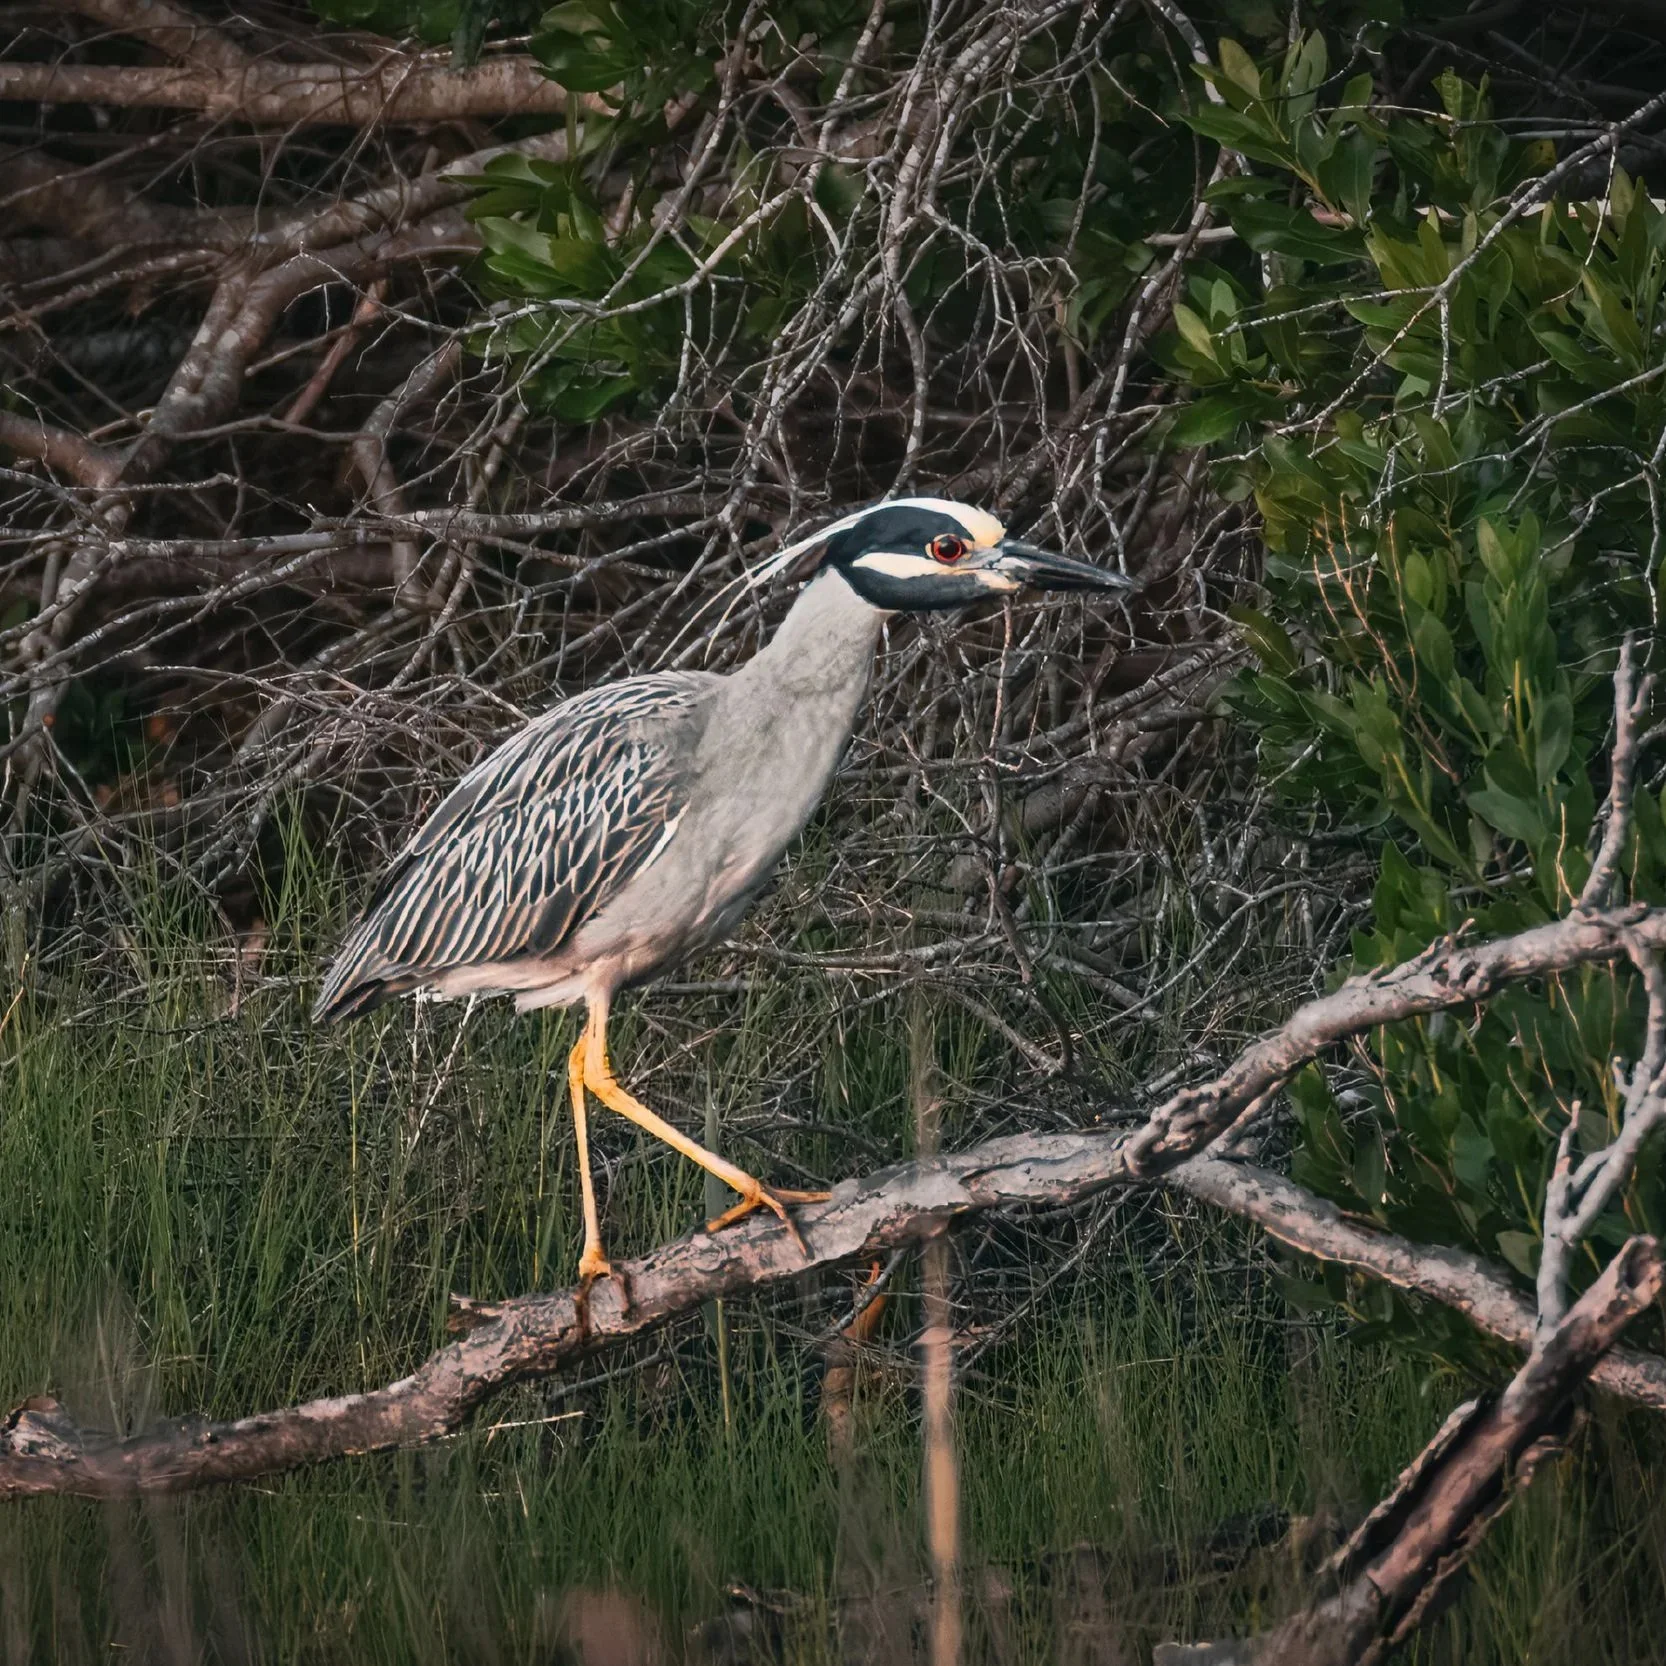
A large part of the year’s interest sits beyond the most frequently reported birds. Twenty-eight species appeared on only one group-collapsed outing, and nine appeared on two. A one-outing record doesn’t necessarily mean a bird is regionally rare. It may reflect migration timing, limited access, low detectability or simply the chance of one observer being in the right place. The single-outing group included American Oystercatcher, American Woodcock, Brant, Long-tailed Duck, Rusty Blackbird, Upland Sandpiper, Virginia Rail and several migrant warblers. Yellow-crowned Night Heron appeared on seven outings, concentrated around Ballard Street and broader Rumney Marsh locality labels. Short-eared Owl appeared repeatedly in late fall, winter and early spring, while the Upland Sandpiper appeared once on May 3rd, 2026. Both Short-eared Owl and Upland Sandpiper are listed as Endangered under the Massachusetts Endangered Species Act, which makes even limited public records worth noting carefully.
These observations also demonstrate why the annual total shouldn’t be reduced to a contest for the longest list. A common bird reported across half the year and an unusual migrant reported once tell different ecological stories. One indicates persistent habitat use. The other may reveal a narrow migration window, a temporary food source, a weather event or an under-surveyed corner of the landscape. Both add information.
Where the next year of observation could improve
The clearest opportunity is to fill gaps rather than simply add more checklists to the same well-covered times and places. None of the 250 distinct outings began before 5:00 a.m. or at 8:00 p.m. or later, and only two began during the 7:00 p.m. hour. Short-eared Owl was the only owl species recorded. Carefully planned evening, nighttime and pre-dawn surveys could improve coverage of owls, nocturnal migrants and secretive marsh birds. The goal would not be indiscriminate disturbance or playback. It would be deliberate, low-impact observation using appropriate protocols and, where useful, passive acoustic monitoring.
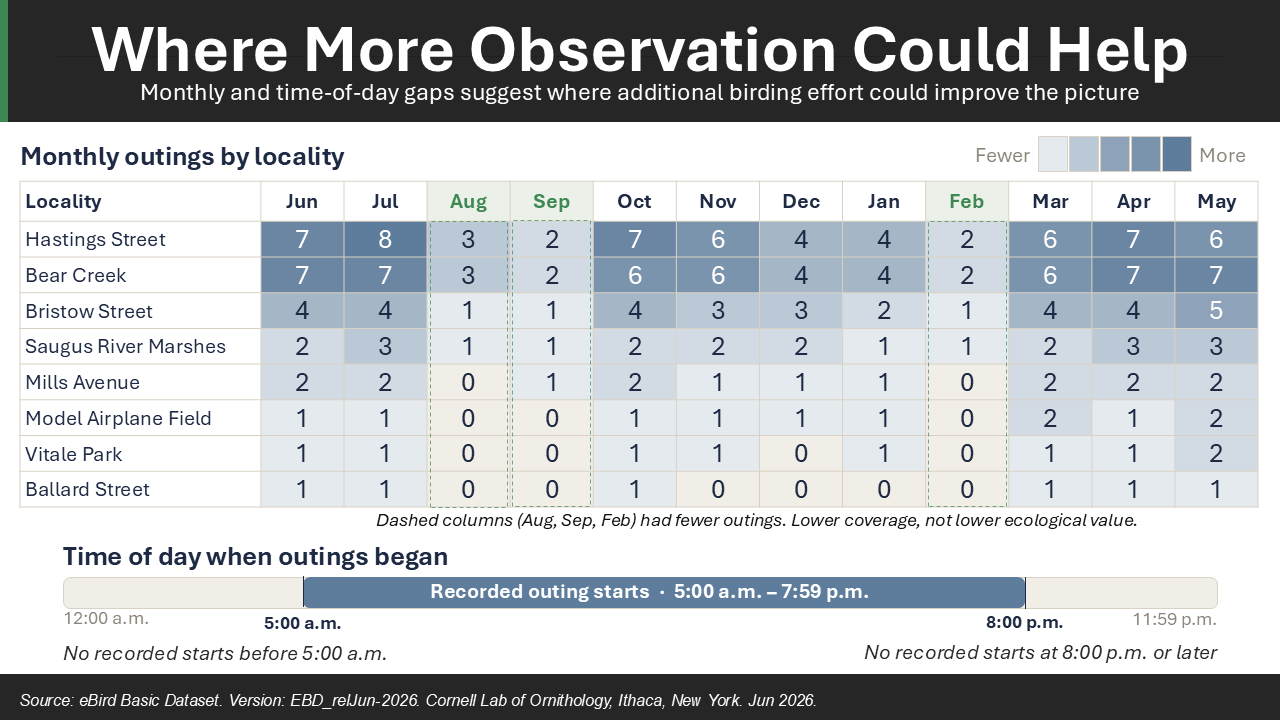
August, September and February also stand out as thin months. September’s nine outings and less than three documented hours leave a particularly large hole during fall migration. Ballard Street, Oak Island Pannes, the Pines River, Northern Strand viewpoints and eastern-edge locations all received limited repeat coverage. More visits to these smaller windows could improve the marsh-wide picture without requiring access to sensitive interior habitat. Tidal timing should also be recorded more deliberately. High tide, falling tide and exposed mudflat conditions can produce very different bird lists at the same access point.
The largest long-term opportunity is standardization. A small set of repeat routes visited monthly, with complete checklists, consistent duration and distance, tide stage and basic weather notes, would create a stronger annual comparison. Dedicated surveys for Saltmarsh Sparrow, rails, winter raptors, shorebirds and grassland birds could supplement general birding. Over time, the question could shift from “What has been seen?” to “What appears to be changing?” The present dataset is not enough to establish population trends, but it is more than enough to design a better monitoring program.
What this year tells us
The strongest conclusion isn’t that Rumney Marsh had exactly 143 species, or that one access point defines the estuary. The stronger conclusion is that the Rumney Marsh and Saugus River landscape supports a remarkably broad overlap of coastal, marsh, river, grassland, upland and urban-edge bird life, and that the public record depends heavily on where sustained access is possible. Hastings Street revealed a concentrated Saltmarsh Sparrow and Clapper Rail signal. Bear Creek showed what long, organized surveys can document in restricted grassland and landfill-edge habitat. Bristow Street produced 89 species from only 36 outings. Smaller windows such as Ballard Street contributed distinctive records that would be easy to miss in a site-by-site ranking.
The eBird record is valuable precisely because it is incomplete. It tells us what observers found, but it also maps where observation is easy, where it is organized and where it is still sparse. Every checklist adds a window. A more complete understanding of Rumney Marsh will come from widening those windows, repeating them through the seasons and connecting community observations with structured ecological monitoring.
Methodology and data source
Sample period: June 1st, 2025 through May 31st, 2026. Species totals include eBird records categorized as “species.” Domestic taxa, slash categories, broader unidentified species groups and identifiable subspecies groups were excluded from the species total. Distinct outings were calculated by consolidating checklist submissions sharing an eBird Group Identifier. Submissions without a Group Identifier were treated as separate sampling events. Site species totals are cumulative detections during the sample period and are not estimates of habitat quality or population size. Monthly and locality totals are affected by access, effort, protocol, observer skill, season, tide and weather.
Data citation: eBird Basic Dataset. Version: EBD_relJun-2026. Cornell Lab of Ornithology, Ithaca, New York. Jun 2026.
